
Reducing oil losses in the mill: loss points, reference figures and monitoring
Why losses matter more than they appear
OER only shows the oil that was recovered. Oil that is lost is never recorded in the tanks, so a drop in OER can come from fruit quality or from rising losses. Monitoring losses separates the two. The scale is large too: at a mill processing 400 t of FFB a day, every 0.1 point of losses against FFB equals 0.4 t of CPO a day. At an illustrative CPO price of Rp 15,000/kg, that is worth Rp 6 million a day.
Main loss points and reference figures
The table below is the breakdown of estimated losses from an MPOB (Malaysian Palm Oil Board) engineering bulletin, citing Ng (1993). These figures are a general reference from Malaysia. Fruit condition, machinery and sampling methods at your mill may differ, so set your own internal targets.
| Loss point | Station | Estimate (% of FFB) |
|---|---|---|
| Fibre after press | Press | 0.55 |
| Nut surface after press | Press | 0.05 |
| Oil absorbed on empty bunch surface | Thresher | 0.45 |
| Fruit carried over with empty bunches | Thresher | 0.02 |
| Unstripped bunches | Thresher | 0.05 |
| Sterilizer condensate | Sterilizer | 0.10 |
| Sludge from separator | Clarification | 0.45 |
| General spillage and tank washing | General | 0.10 |
| Total | 1.77 |
The same bulletin classifies mill performance by total oil losses: below 1.3% good, 1.3–1.8% average, and above 1.8% poor. An MPOB survey of six mills found that mills without an empty bunch press generally recorded high losses, at 2.08–2.38% of FFB.
From sample oil content to losses against FFB
The laboratory measures the oil content of a sample, such as the percentage of oil in wet fibre. This figure cannot yet be added across points. First convert it into losses against FFB:
Illustration: a fibre oil content of 5.5% with a fibre ratio of 12% to FFB gives losses of 5.5 × 12 ÷ 100 = 0.66% of FFB. Empty bunches with an oil content of 2.0% and a ratio of 22% give 0.44%. Material ratios differ from mill to mill. Measure your own ratios and update them regularly; do not copy figures from another mill.
Monitoring per station and per shift
A consistent sampling schedule
- Define the points, frequency and method of sampling for each station, and write them down. Take fibre and nut samples from every press, not just one.
- A composite sample per shift is more representative than a single spot sample.
- Record who took and analysed each sample, because a change of method often makes figures jump without any change in the process.
Calculate the daily figure from a weighted total
As with OER, daily losses should be weighted by FFB processed per shift, not averaged:
Illustration: fibre losses of 0.60% on 300 t in shift 1 and 0.80% on 100 t in shift 2. Daily losses = (0.60 × 300 + 0.80 × 100) ÷ 400 = 0.65%, not 0.70%.
Flag incomplete data
If one point has not been sampled, that day’s total losses are bound to be too low. Mark the day as incomplete; do not fill the gap with the target value.
Follow-up per point
| Losses rising at | What is usually checked |
|---|---|
| Fibre and nut | Press pressure, wear on the screw and press cage, digester temperature and agitation |
| Empty bunches | Sterilizer cycle and pressure, thresher operation, unripe fruit in the supply, availability of an empty bunch press |
| Condensate | Condensate discharge cycle and oil trap at the sterilizer |
| Sludge and effluent | Dilution and temperature in clarification, separator and decanter operation, retention time in the tanks |
The role of the daily mill report
The daily mill processing report (Laporan Harian Pabrik, LHP) brings together figures that are usually scattered across the laboratory, the process floor and the tanks: FFB processed, CPO and PK, OER and KER, processing hours and downtime, and losses per point. With losses in the same LHP, managers can see at once whether OER fell because of the fruit or because of one station. Without it, losses are often only discussed in the monthly report, when the cause is already hard to trace.
- Compare losses at each point with the internal target, and show the variance, not just the figure.
- Look at 7-day and 30-day trends per point, because gradual increases are more common than spikes.
- Link losses to downtime and machine maintenance; press losses often rise ahead of a scheduled screw replacement.
How Sawitara records it
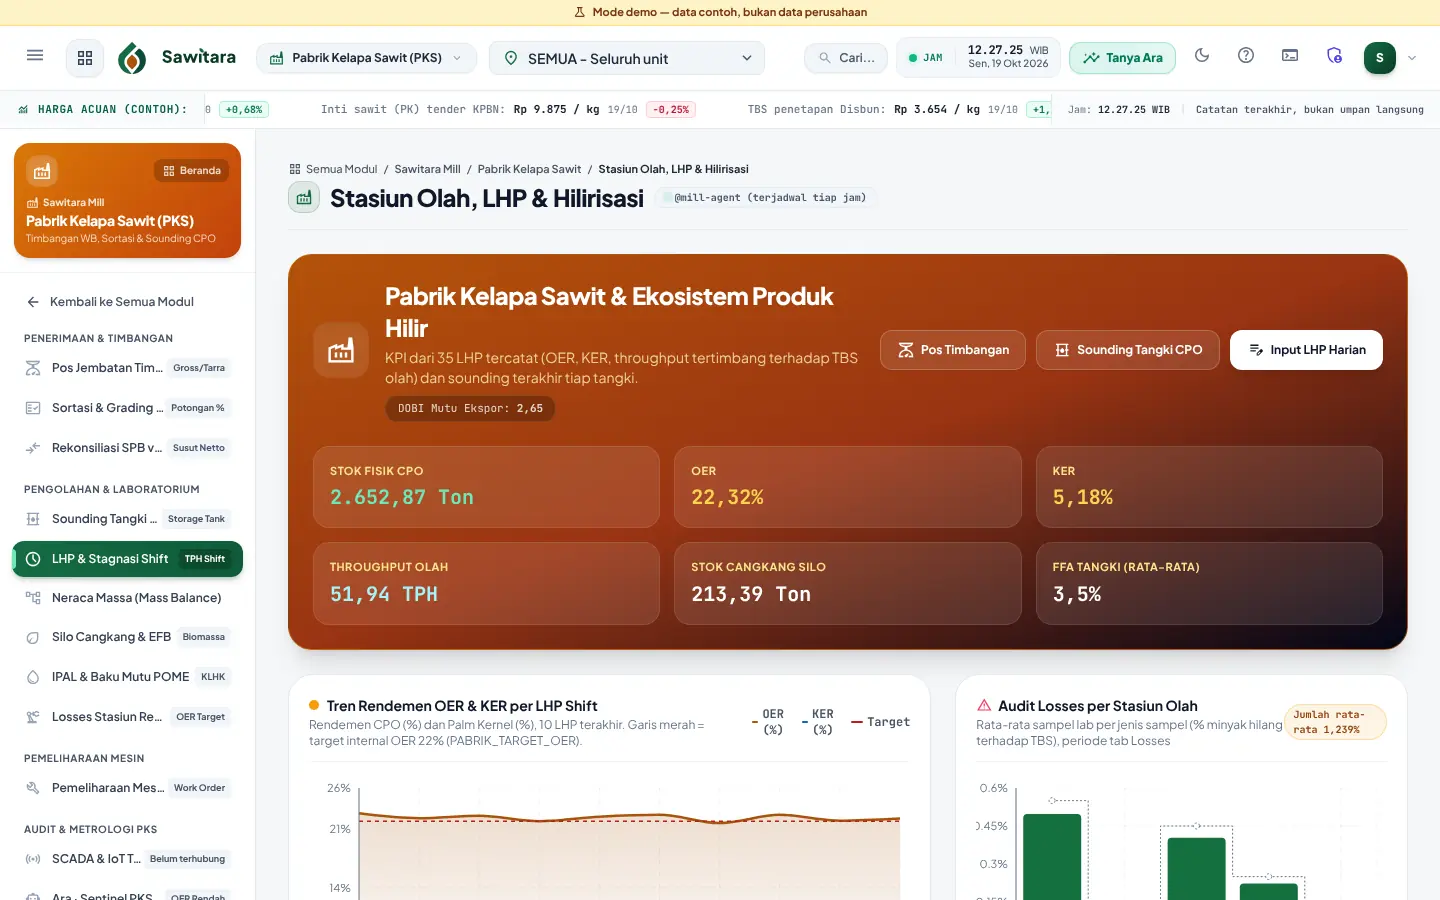
In Sawitara Mill, lab analysts record loss sample results per date, shift, station and sample type: fibre cyclone, nut, empty bunches, condensate and final effluent. Each sample stores the content against the sample and losses against FFB, and both are compared with the internal target you set. Total daily losses are the sum of all sample types; incomplete days are flagged. The LHP per shift calculates OER, KER and throughput, while the mass balance separates measured figures, estimates and what is not measured. The mill flow from weighbridge to ticket is shown in the Mill module video tutorial. To estimate the value of each OER point at your mill, try the ROI calculator.
Sources
- Adzmi Hassan et al., "Improving Mill Oil Extraction Rate under the Malaysian National Key Economic Area", Palm Oil Engineering Bulletin No. 103, MPOB. Table 3 (estimated oil losses, from Ng 1993) and loss performance bands
- MPOB, Palm Oil Engineering Bulletin No. 127. Further reading on mill efficiency
See Sawitara with demo data
In 15 minutes we walk you from estate to general ledger, then discuss the products you need.